Contract logistics · APAC
Building a regional CI engine from zero
~$800K savings a year; model adopted company-wide
APAC operations had no structured continuous improvement framework. Improvement work was ad hoc, there was no pipeline of trained practitioners, and savings were not tracked.
How we did it
What we did
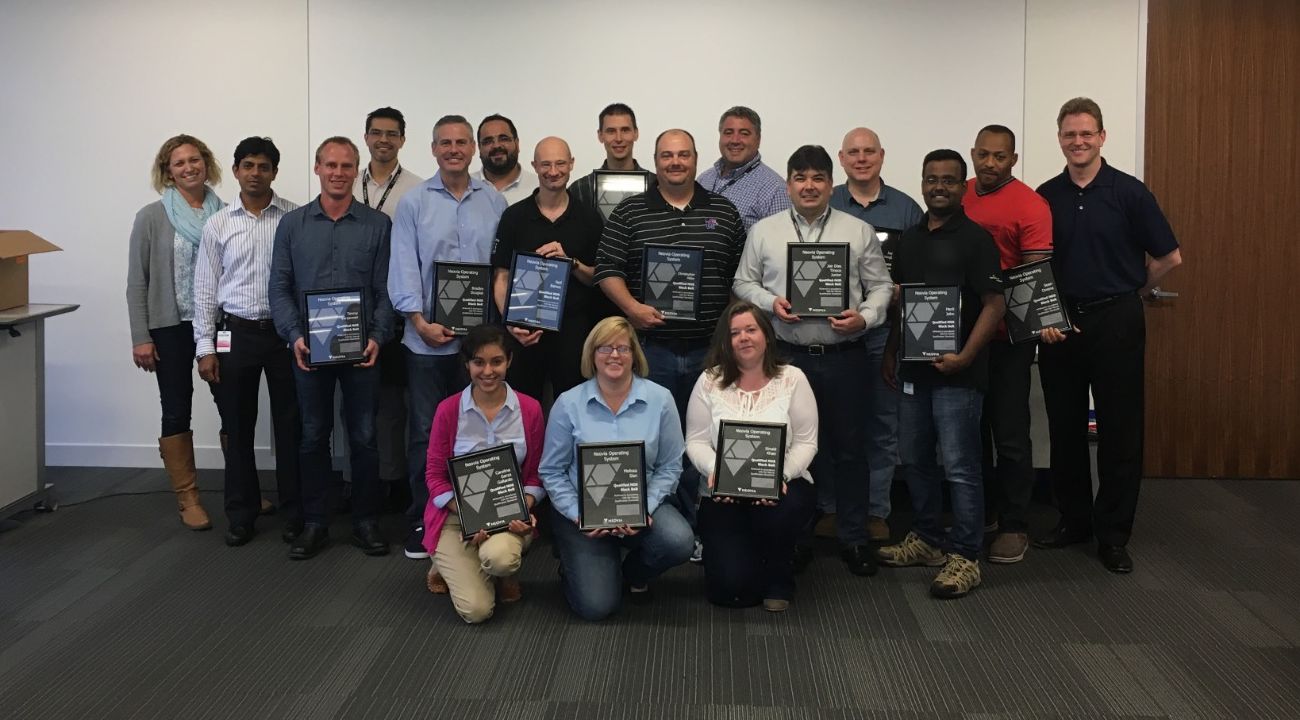
- Designed the regional transformation framework with the APAC Vice President of Operations.
- Set up a governance model to train, coach and certify Green Belts and Black Belts, and to track every project.
- Created a dedicated project team, separate from day-to-day operations, to drive transformation work.
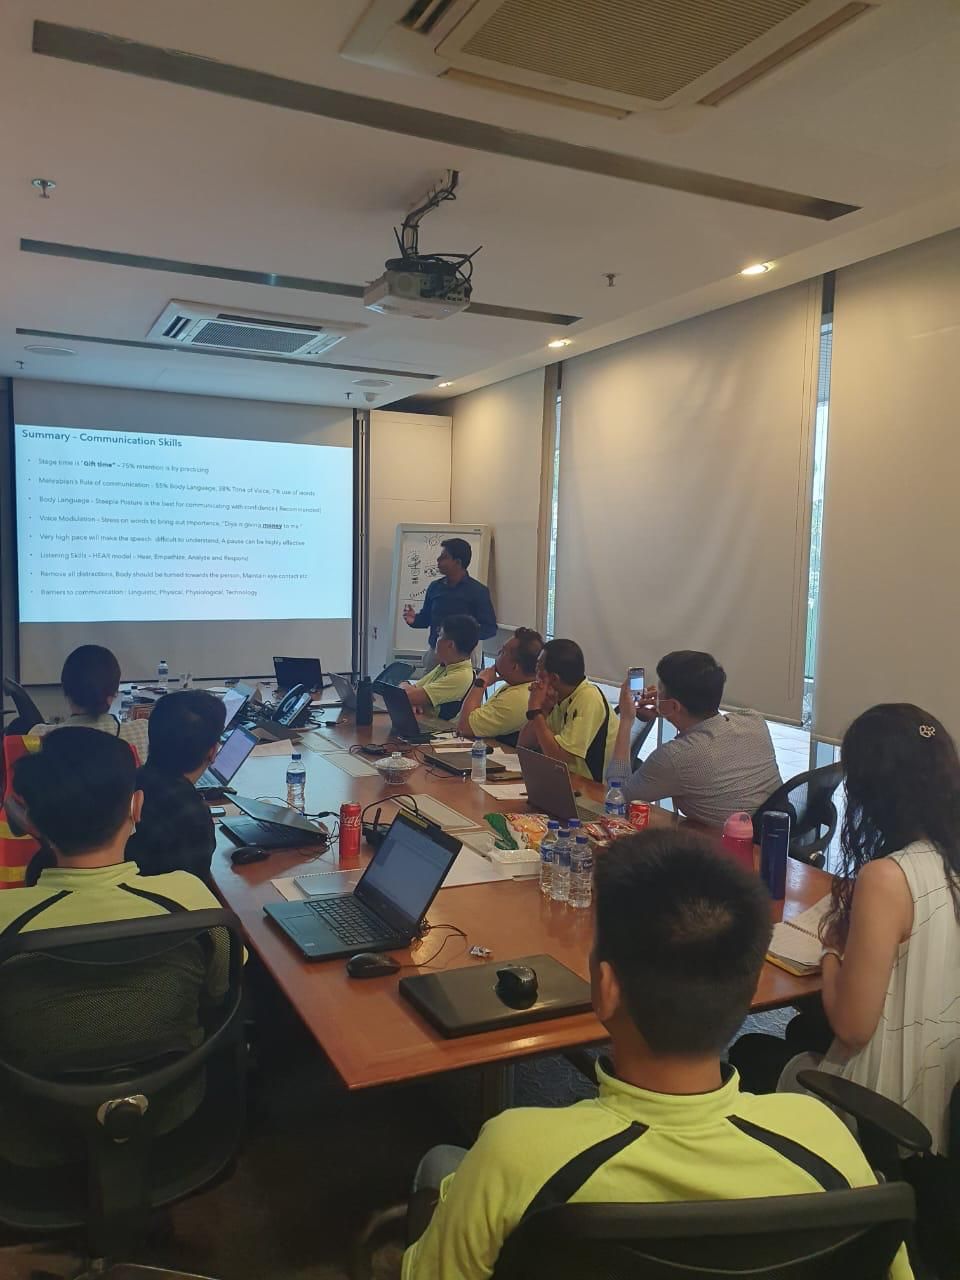
- Trained leaders and champions so the framework would stick.
The results
- About $800K in savings every year, meeting the annual business-plan target.
- Adopted company-wide: the APAC model was replicated in EAME and the Americas.
- Core Value Award for Outcomes, given to the company's top 5 performers worldwide.
A region with no CI capability became the template for the whole company.
Automotive aftermarket · Japan
Turning a $500K loss into a $200K gain
A $500K loss turned into a ~$200K gain
Productivity at the site had collapsed and losses passed $500K. Nobody could explain why: headcount and effort were unchanged, but output per hour kept falling.
How we did it
What we did
- Formed a task force of Black Belts, Finance, Operations and Commercial leaders.
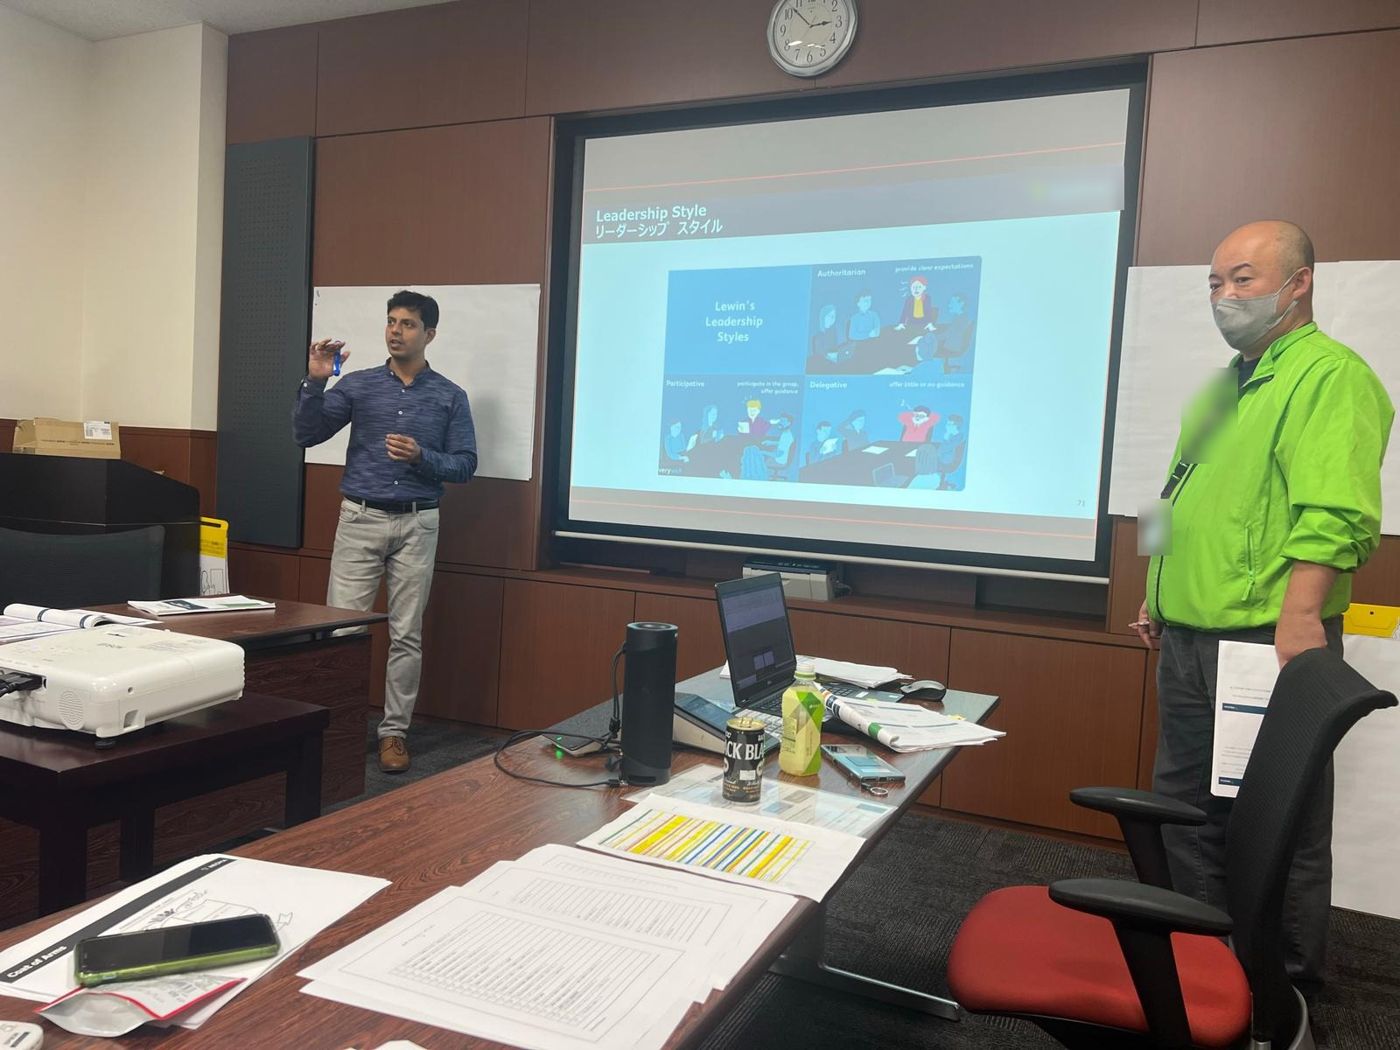
- Ran onsite workshops and time-and-motion studies. These showed that emergency order lines ran at about 30 lines/hour, against about 15 for stock order lines.
- Proved the root cause: the client's order mix had moved from the contracted 80:20 to about 50:50, toward slower, labour-heavy stock orders.
- Built a financial baseline separating the mix effect from site performance: $0.3M net adverse impact over 16 months.
The results
- Contract renegotiated with the client, adding special service-request charges.
- Losses eliminated and turned into gains of about $200K.
When the data tells the story, a difficult commercial conversation becomes a fair one.
Shared services · Global
Clearing a 531-ticket IT backlog in three months
Backlog cut from 531 to fewer than 10 in 3 months
Escalations were constant. The backlog stood at 531 tickets, 80% of them older than 60 days. SAP account creation took about 85 hours of elapsed time, and some requests sat open for more than 100 days.
How we did it
What we did
- Mapped the as-is process. The bottleneck was multi-step email approvals, which averaged about 80 hours.
- Replaced email tracking with a workflow application, and set automatic reminders after 24 hours.
- Cut the number of approvers and moved to a single-piece "one-to-many" approval flow.
- Gave SAP requests (~28% of volume) a dedicated resource instead of multitasking, and split simple requests from bulk ones.
- Introduced a capacity-management tool and live dashboards.
The results
- Backlog cut from 531 to fewer than 10 tickets in 3 months.
- Escalations dropped away, and the improvement was confirmed with 2-sample hypothesis tests.
From 500+ escalated tickets to a near-empty queue in one quarter.
Heavy equipment parts · Japan
Re-engineering a labour-constrained distribution centre
$924K/yr cost reduction, 19-month payback
The local workforce was ageing: 54% were over 45, and the population was forecast to fall 4.5% by 2030. A new logistics mega-complex next door would compete for the same workers. The site had to cut labour demand while still meeting contract commitments. It was also paying for offsite overflow storage.
How we did it
What we did
- Removed fixed conveyors in receiving and packaging, and replaced them with mobile workstations and roller cages.
- Freed 1,400 m² of prime floor space and created 2,800 new storage locations. The building's 8 m clear height was now used, instead of 2 m.
- Re-slotted fast movers closer to receiving and shipping, and brought 18,000+ slow-moving parts back in from the offsite facility.
- Introduced autonomous mobile robots to cover the 375 m one-way trip from receipt to storage.
- Built the capital case using MOST time analysis.
The results (capital business case)
- $924K a year in operating cost reduction: $401K from offsite storage, $301K from material flow, $222K from productivity.
- $5.7M incremental EBITDA and $2.9M incremental cash flow (NPV) on a $1.2M investment.
- Payback in 19 months.
Answering a labour shortage with better design, not more headcount.
Automotive · Thailand
Pull flow for export pick and pack
200 labour hours saved every week; $36K EBITDA/yr
Export orders were released in one large wave (95% between 8 and 10 am) and picked as fast as possible: a push system. Packing could not keep up. It ran at 2.13 cases/hour against a requirement of 3.21. Picked parts blocked the aisles, export WIP grew 44% in one quarter (99 → 143 m³), and parts were handled twice. That cost about 1,250 labour hours a year.
How we did it
What we did
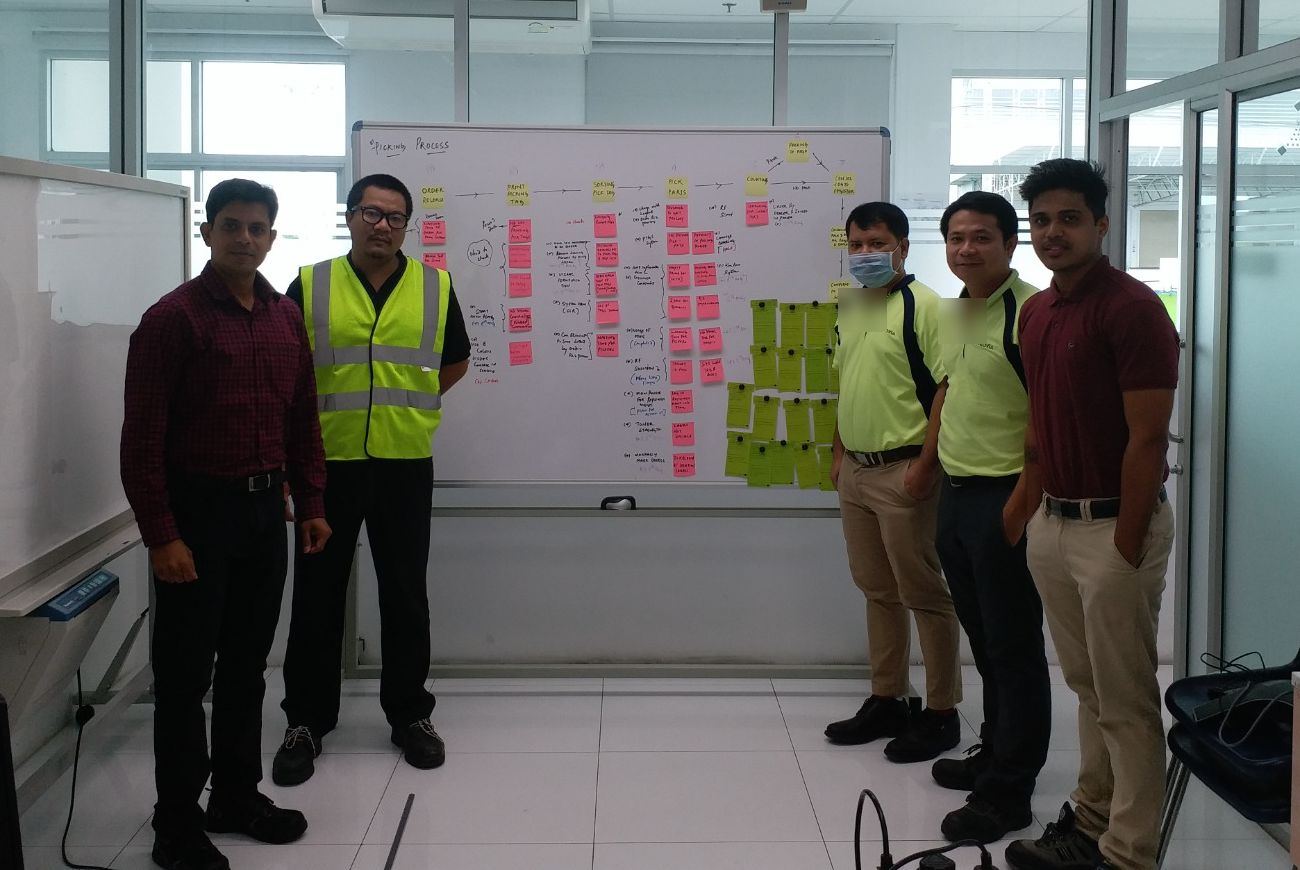
- Ran a DMAIC Kaizen with a Green Belt team, measuring release, pick and pack rates side by side to prove that packing was the bottleneck.
- Ran brainstorming and fishbone sessions that produced 32 improvement ideas, then used a Pugh matrix to choose the best design.
- Designed a "to-be" daily rhythm. Pickers feed packing at a steady 57.5 m³ an hour and stop when the WIP area is full.
- Added dedicated bin-area pack stations and more rack-packing capacity, and prioritised markets to cut ageing cargo.
The results
- Blocked aisles eliminated through pull-based picking.
- About 200 labour hours saved every week.
- $36K EBITDA a year, beating the $24K target.
Matching picking to packing turned congestion into flow.
Automotive · Thailand
Doubling outbound picking productivity
Picking rate ~24 → ~46 lines/hour (trial)
Outbound pickers walked long distances pushing heavy trolleys. Productivity averaged about 24 lines/hour, fatigue was high, and attrition was running at around 90 days. Hitting target needed 15 FTEs.
How we did it
What we did
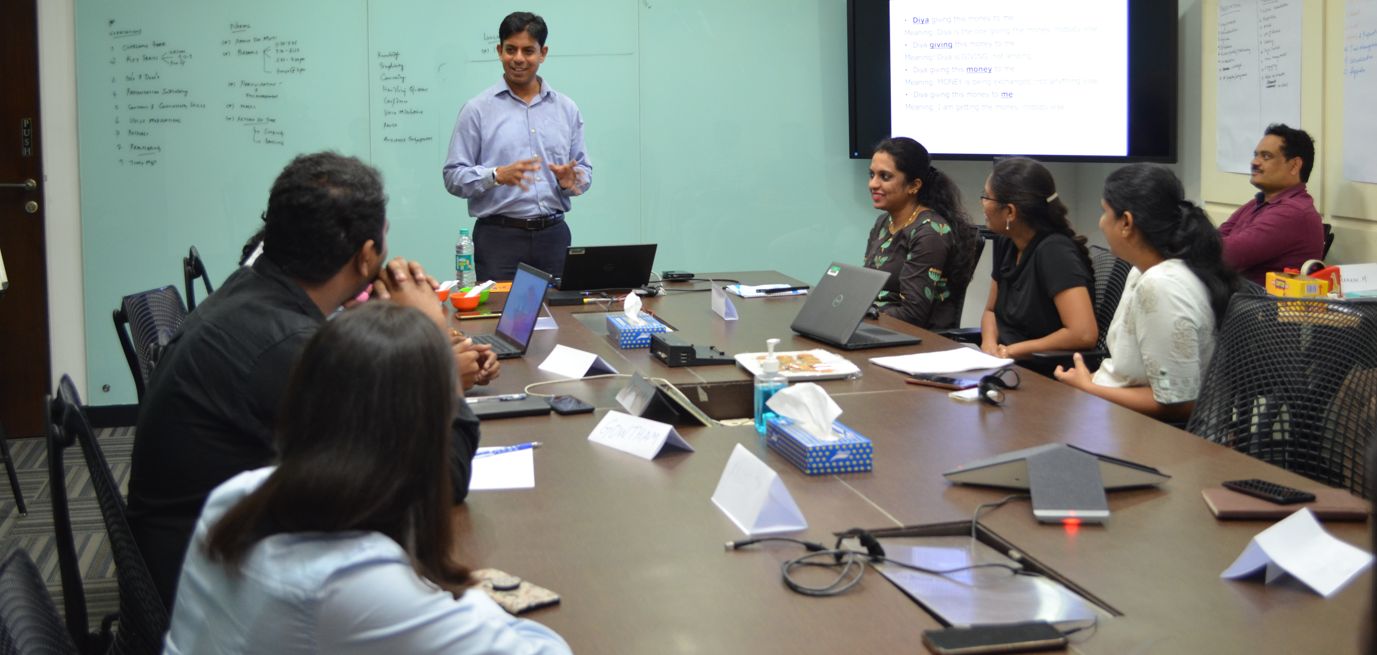
- Ran a hands-on Green Belt training workshop: 5S baseline, spaghetti maps, value stream mapping and root cause analysis on the floor.
- Merged order release and sorting into one step, and introduced a flag-based pull signal so pickers take tickets only when they are ready.
- Introduced order-picker trucks in place of manual trolleys, along with visual management, Thai-language work standards and a picking-productivity dashboard.
The results
- Picking rate rose from ~24 to ~46 lines/hour in the order-picker trial.
- FTE requirement fell from 15 to 10, an estimated $35K a year benefit.
- 22 improvement ideas implemented by the team, with better ergonomics and lower fatigue.
Less walking, more picking, and a team that now owns its own improvements.
Industrial machinery · Japan
Recovering a 60% drop in inbound productivity
60% productivity drop diagnosed; new layout live
After one client's operation was separated into its own flow, inbound productivity fell from 15.5 to 6.2 lines/hour, a 60% drop. Cross-dock lines needed extra putaway, the conveyor failed more than 20 times a day, and WIP and damaged goods took over the floor.
How we did it
What we did
- Ran a Green Belt workshop with stationary observations, root cause analysis of conveyor failures and packing-line congestion, and a "cardboard city" layout simulation.
- Prioritised actions and trialled the new process before rollout.
- Redesigned the layout. Material now flows directly with no sorting boxes, WIP sits next to the packing tables, and caged storage uses vertical space.
- Fixed the conveyor and introduced clear large/small part sorting guidance.
The results
- New inbound layout live, with a simpler material flow and floor space recovered.
- 24 improvement ideas raised and 20+ actions completed through the workshop programme.
- Conveyor errors cut, with more product flowing through the conveyor line.
A 60% productivity collapse diagnosed and redesigned.
Luxury automotive · Singapore
Fixing flow in a premium-auto packing area
13-point plan targeting +14% productivity
The client's outbound target was 20.57 units/hour, but the site was running at 18.22 and declining. The urgent-order (VOR/emergency) packing area was congested, packers walked away to fetch materials, and nobody had clear ownership of sorting.
How we did it
What we did
- Ran a Green Belt workshop with spaghetti mapping, time studies and NVA analysis. Sorting and checking pick tags turned out to be the biggest time sinks.
- Ran root cause analysis on RF under-use and long picking times, then trialled new carton layouts and customer labelling.
- Delivered 5S before-and-after improvements and a 13-point action plan with owners. It covers dashboards, mobile workstations, RF packing, SAP carton suggestions and low-level racks for materials.
The results
- A clear path to +14% productivity: packing from 48 to 55 units/hour, with non-value-added time cut by 14%.
- Sorting ownership defined, and the 5S standard reset across the area.
A congested packing area mapped, cleaned up and set on a +14% roadmap.
Heavy equipment parts · Japan
Ending the "treasure hunt" in cross-dock
10% cross-dock hours reduction targeted
Packaged parts became available for sale before they were put away to a rack. Customers could order items the floor team could not find, so staff searched the site before every cut-off. Cross-dock work consumed about 900 hours a month, and volume rose 25% in one month (1,507 → 1,882 lines/day).
How we did it
What we did
- Mapped the as-is flow for packaged and non-packaged parts and observed the waste directly on the floor.
- Generated 20 improvement ideas through brainstorming and fishbone analysis. Multi-voting and a Pugh matrix narrowed them to 3 main actions, agreed with the sponsor and process owners.
- Built a 30-day plan covering manpower planning, a system (IT) process change to track item location before putaway, and training.
The results
- 10% reduction in cross-dock hours targeted, worth about $22K a year.
- Location visibility built into the system, replacing searches that relied on people's memory.
A system fix that tells the team where the part is before anyone goes looking.
Automotive · Thailand
Making the commercial case for fee recovery
$290K of unfunded cost quantified for renegotiation
The site was losing money, and the cause was not operational performance. Actual work had drifted far from the assumptions in the contract. Leadership needed evidence before going back to the client.
How we did it
What we did
- Compared actuals with contract assumptions line by line across packaging, inbound mix, putaway and non-contracted costs.
- Found that packaging volume ran 87% above contract: 4.09M pieces against 2.19M assumed, at 134 pieces per line against 70.
- Showed that the inbound mix had shifted toward labour-heavy domestic receipts, and that system limits forced 30% of putaways into multiple steps.
- Built a cost-per-line model for export. Each line cost $4.05 to process against a $1.45 fee.
The results
- $163K of contract deviations quantified over 7 months, plus $127K in export losses over 3 months.
- Export cost per line cut from $4.05 to $3.09 as the operation stabilised.
- A fact-based case for fee and scope renegotiation.
Turning a vague "we're losing money" into a costed, line-by-line case the client could not ignore.
Legal technology · India & US
A five-project Six Sigma programme
First-time-right 77% → 90%+; billable hours tripled
Customer satisfaction was falling. First-time-right quality was low, deliveries were slipping, billable work was going unbilled, and teams were narrowly skilled.
How we did it
What we did
Ran five DMAIC projects together, using hypothesis testing (chi-square), value stream mapping (process cycle efficiency was just 8%), push-versus-pull queue analysis, control charts and audits.
The results
| Problem | Before | After |
|---|
| Production first-time-right | 77.4% | 90%+, sustained up to ~98% |
| Use of the in-house conversion tool | 4% | ~60% of eligible work |
| Delivery TAT adherence | below 90% | ~100% |
| Billable effort captured | 37% of billable tasks | Billable hours tripled in 6 months |
| Cross-skilled ticket handling | ~8% | ~40%+ |
Five problems, one method, and measurable gains in quality, speed and revenue.
Multi-sport facility · India
Filling the grounds: growing a sports facility's revenue by 83%
Revenue ₹30 lakh → ₹55 lakh; occupancy 30% → 55%
The facility had good grounds but low utilisation. Ground occupancy stood at 30% and revenue at ₹30 lakh, so most of the available capacity was going unsold.
How we did it
What we did
- Brought cricket and sports academies on to the grounds as regular, long-term users.
- Tied up with major cricket leagues and academies for matches, tournaments and training slots.
- Set up the facility's own academy, creating a steady base of coaching revenue.
The results
- Revenue grew from ₹30 lakh to ₹55 lakh, an increase of about 83%.
- Ground occupancy rose from 30% to 55%.
- A new in-house academy, adding a recurring revenue stream.
Empty ground hours are lost revenue. Partnerships and an in-house academy filled them.
Your organisation · Anywhere
Your project could be next
Every one of these started with a conversation about what was not working. Tell us about yours.